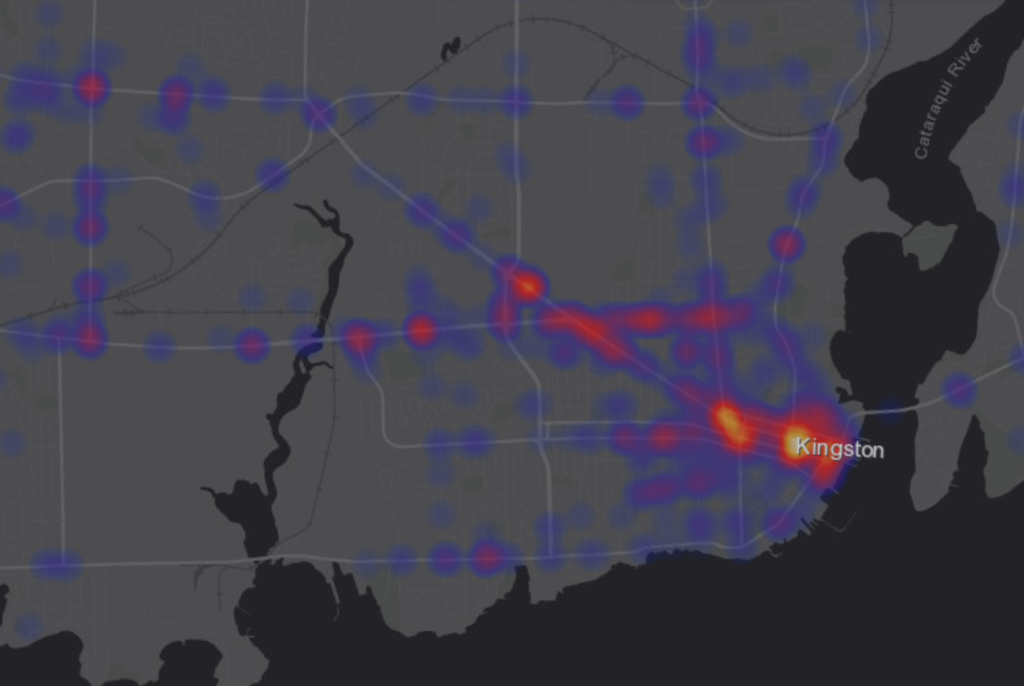
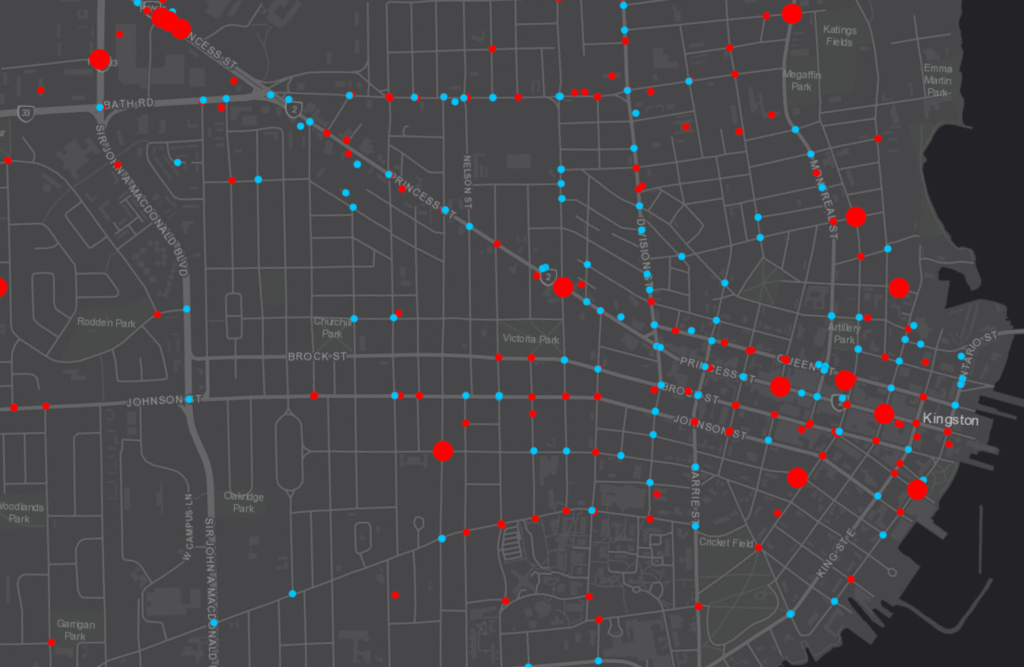
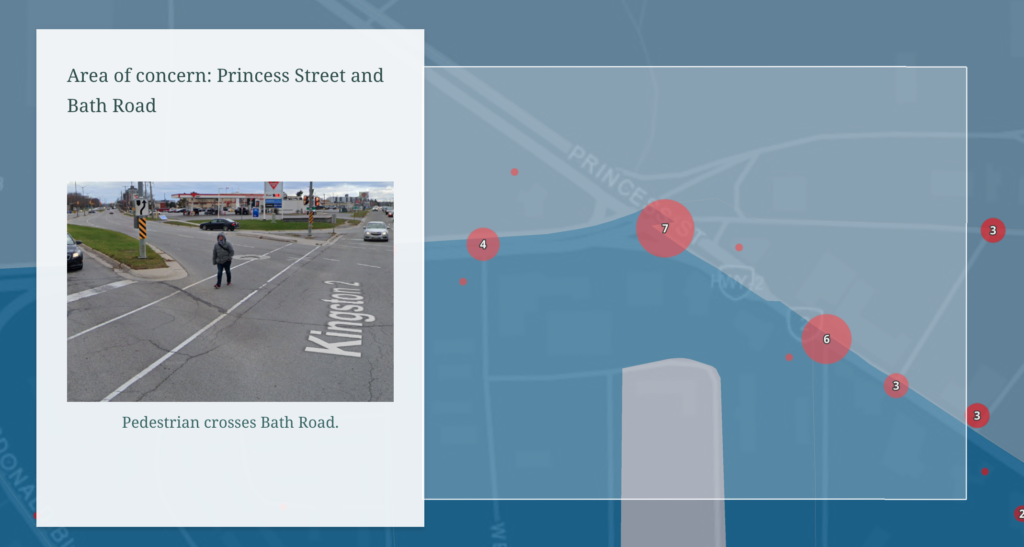
Using data to tell a complex story can be a powerful strategy. In 2023, I used ArcGIS Online to create a ‘StoryMap’ webpage in order to present 13 years of vulnerable road user collision data provided by the City of Kingston. By mapping this data, I was able to visually communicate high-collision areas and areas of increased danger due to equity-related risk factors.
The StoryMap concludes with three recommendations that could enable the City of Kingston, and other municipalities, to decrease the injuries and deaths of pedestrians and cyclists:
- Embed an equity lens when prioritizing road safety efforts. This strategy will ensure that road conditions are safest for those who are most impacted by traffic violence.
- Focus road safety efforts in areas with high collisions and transportation inequities such as those with lower income and those who are public transit dependent.
- Use existing data to prioritize road safety efforts towards inequitable areas of concern. Limit the use of complaint-based traffic calming requests which tend to favour those with higher incomes and those who are less vulnerable to vehicle collisions.